
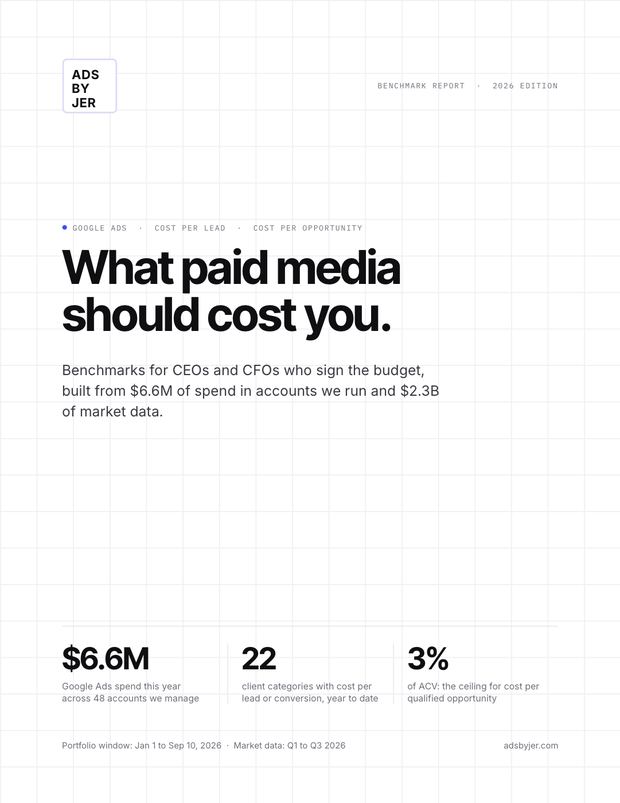
What paid media should cost you.
The 2026 benchmarks for B2B SaaS, for the people who sign the budget. What paid media should cost, and the one rule that says whether it's building the company or draining it.
It's on its way.
The 2026 Benchmark Report is landing in your inbox now. Prefer it right away? Grab it below.
Download the report (PDF)- Cost per lead by industry and deal size, across 12 verticals
- The brand vs non-brand split most teams never separate
- The 3%-of-ACV rule for cost per qualified opportunity
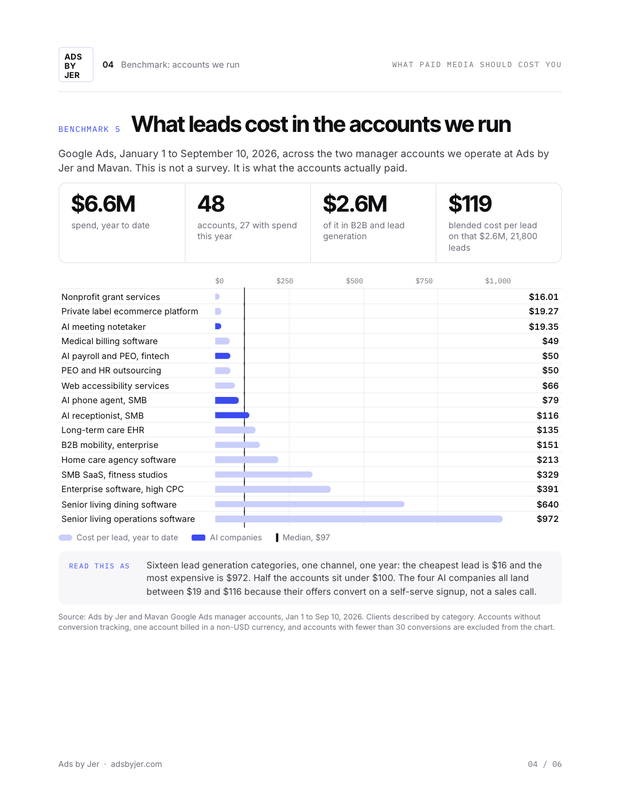
- What $6.6M across 48 live accounts actually cost per lead
- For CEOs, CFOs & VPs of Marketing
- B2B SaaS, Series B to D
Trusted by the teams behind $100M+ in paid media





The operators who trusted Jer with the number.
He took full ownership of paid search and turned it into one of our most reliable, efficient pipeline engines.30–40% of pipeline & ARR

Jer brought a ton of value and insights from his growth marketing experience that helped shape our own strategies.

He stood up our marketing function from scratch and brought much-needed expertise in demand gen.

Seven pages. Every number sourced.
Published benchmarks by industry and deal size, the brand vs non-brand split, and $6.6M of our own spend across 48 accounts, broken down by what each lead actually cost.
Five benchmarks, and the framework to read them.
The three numbers to ask for
Cost per lead, cost per qualified opportunity, and CAC payback, with the healthy range and the red flag for each.
Cost per lead by industry and deal size
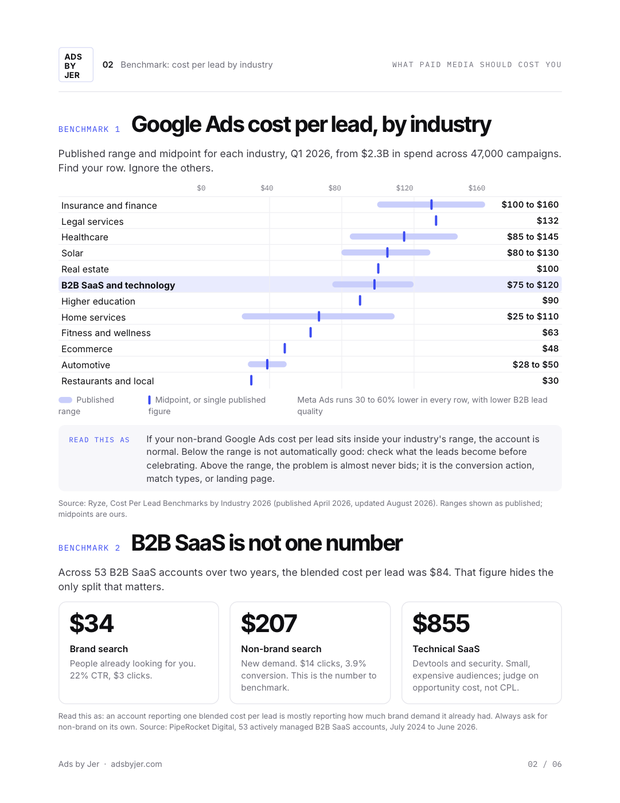
Published ranges across 12 industries and five ACV bands, plus the LinkedIn vs Google split by vertical.
The brand vs non-brand trap
Why a blended cost per lead hides the only split that matters, and the number you should actually benchmark.
What we see in the accounts we run
Real cost per conversion across live B2B and consumer accounts, and how to read your own account in four steps.
Ask for three numbers. Judge on one.
Most teams report cost per lead. Few can report cost per qualified opportunity. Only the third number tells you whether paid media is building the company or draining it.
Cost per lead
What you pay for a form fill. Easy to report, easy to game. Healthy when it sits inside your ACV row; a red flag when there's no brand split.
Cost per qualified opportunity
What you pay for a lead sales accepted. This is the number that predicts revenue. Healthy under 3% of ACV; a red flag when nobody can produce it.
CAC payback
Paid cost of a customer divided by monthly gross margin, in months. Healthy under 12 months; a red flag over 18.
The rule
Cost per qualified opportunity should stay under 3% of ACV.
Above that line, the channel is consuming margin no matter how good the lead number looks. Below it, spend can scale. That single comparison decides whether to scale, hold, or cut.
B2B SaaS is not one number
Across 53 B2B SaaS accounts, the blended Google Ads cost per lead was $84. That figure mostly reports how much brand demand a company already had. The split is the point.
Brand search
People already looking for you. High intent, cheap clicks. Not new demand.
Non-brand search
New demand, and the number to actually benchmark against your ACV row.
Technical SaaS
Devtools and security. Small, expensive audiences; judge on opportunity cost, not CPL.
Industry figures compiled from published 2026 benchmarks (Ryze, PipeRocket Digital, GrowthSpree, Stackmatix). Managed-account figures are first-party, from Google Ads accounts run by Ads by Jer and Mavan. Full tables and sources in the report.
Know exactly what paid media should cost you in 2026.
The full 7-page benchmark report, every number sourced, sent straight to your inbox.
Get the free reportPaid media benchmarks, in plain terms.
Want your account read against these numbers?
We run paid media for venture-backed B2B and AI companies, wired to the CRM so the platforms optimize for pipeline instead of form fills. At Pilot, that took paid-driven ARR from $3M to $25M in 20 months.
Prefer to self-diagnose first? Run the Leak Report →